If you’re thinking about getting serious with your food blog, then you should probably have some goals. As with everything else in life, goals help keep your blog on track and keep you moving forward. However, just having a goal often isn’t good enough. In order to make sure you meet your goals, you need to be able to track them.
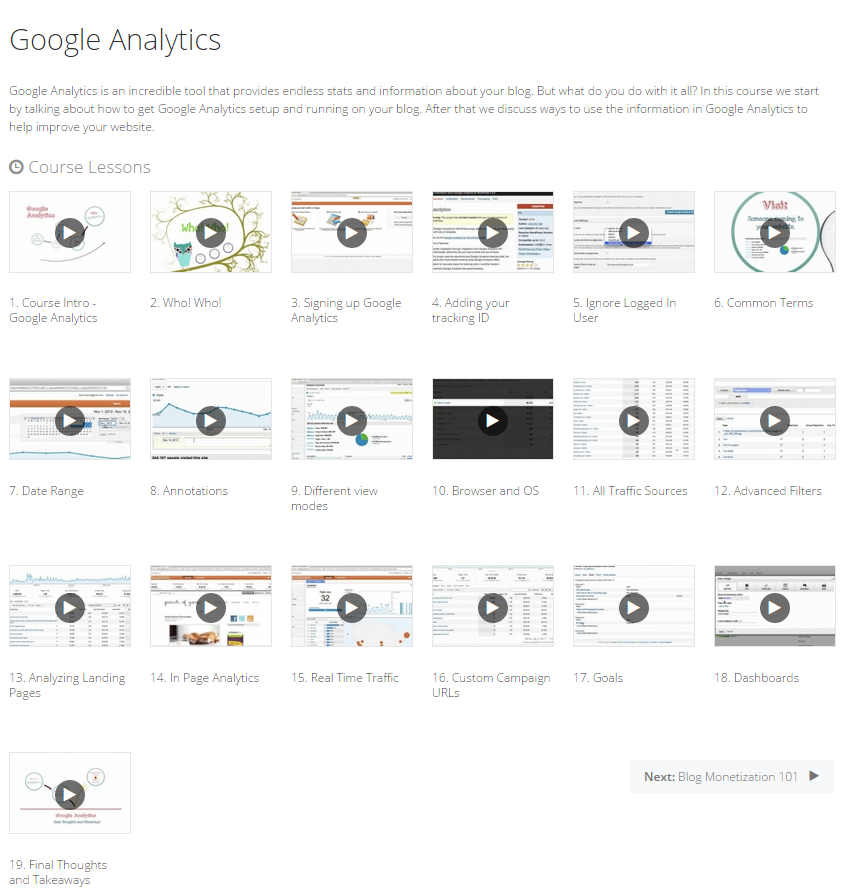
Fortunately, Google Analytics makes it pretty easy to set up and track goals. And even more fortunately, we have a course on setting up Google Analytics here on Food Blogger Pro! If you’re a member, be sure to check it out.
If you don’t have any goals set up and you can’t think of any specific to your blog, set one up that converts when a user visits 3 pages on your blog. This is a super simple yet important goal. The more views you get per user, the more engaged your reader. And better engagement is always good!
Once you have your goals set up, you can look at all sorts of stats about them in your Analytics dashboard. From the total number of completions to the conversion rate (i.e. the percentage of people who completed the goal on your website), there is no shortage of information.
However, one thing that’s not super easy to visualize on a daily basis is what your conversion rate looks like from different sources. What do I mean by that?
Well, Google Analytics not only tracks the number of conversions on your website, but it also knows where each person who made a conversion came from. The place where the person came from is the source.
So if you wanted to find out how many people successfully converted when they came from a Google search vs. FoodGawker on a daily basis, there’s not really a built-in quick & easy way to do that…
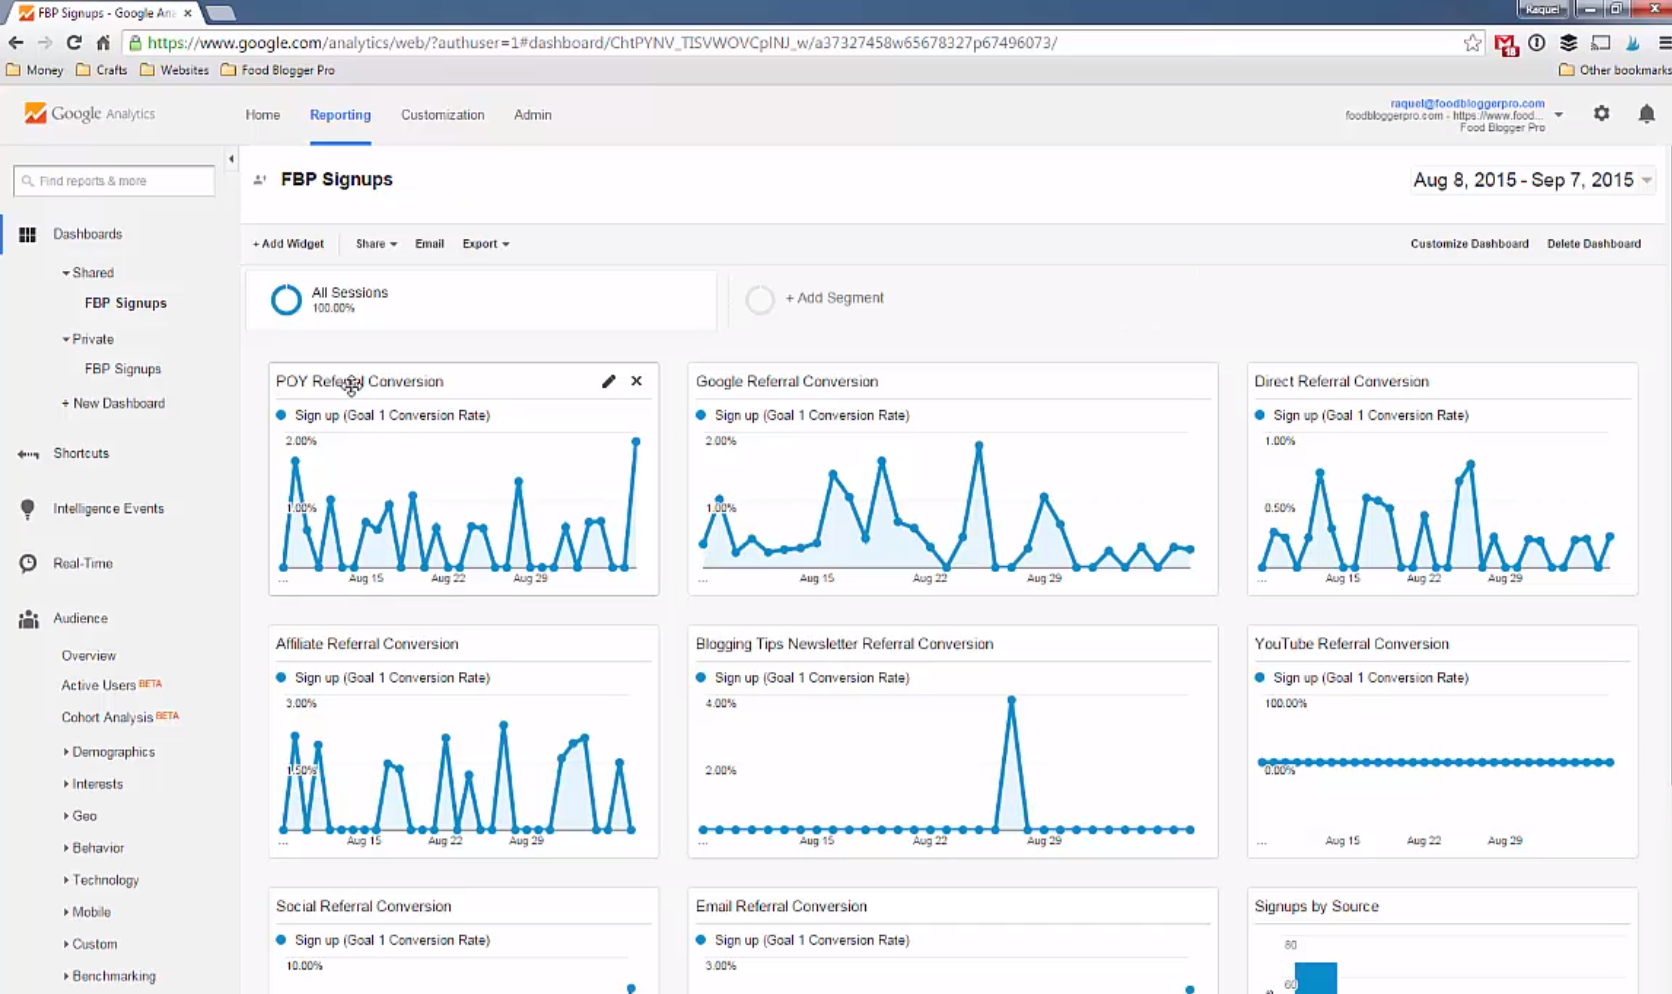
Until now! Here at FBP, we were interested in this exact problem. So, we made a custom dashboard with custom widgets to display our goal conversion rate by source. It’s pretty nifty! We thought you bloggers might be interested in this, too, so I made a screencast that goes over how to set it up.
So pull up your Google Analytics (if you haven’t set it up already, check out the course) and get ready to see your goals come to life!
So what do you think? If you have any questions or feedback on how to get this set up, feel free to leave a comment for me below!