Listen to this episode of The Food Blogger Pro Podcast using the player above or check it out on Apple Podcasts, Google Podcasts, or Spotify.
Welcome to Tiny Bites from the Food Blogger Pro Podcast! In this episode of Tiny Bites, Bjork interviews Alison Bechdol from Digital-ade about GA4 data models and how to change yours if your data isn’t looking quite right.
As of July 1, 2023 Google Analytics 4, or GA4, is the default property within Google Analytics. There is a steep (and, it seems, long) learning curve to using GA4, especially because GA4 uses and collects data completely differently than Universal Analytics (or UA) did. New metrics, new language, new data… it’s a lot to familiarize yourself with!
In this podcast interview (our first episode of Tiny Bites!), Bjork chats with Alison Bechdol (who is also the Google Analytics Expert here at Food Blogger Pro) about some tips and trips that will make this transition from UA to GA4 a little easier.
How to Customize GA4 to be More Like UA
Alison shares the best practices for what to do with the historical data from UA and how to get started with GA4 if you haven’t already done so. She explains some of the key differences in language and definitions in GA4 (i.e. ‘page view events’ is the new page view) and how the definition of users differs between GA4 and UA.
Bjork and Alison also discuss the importance of understanding your Key Performance Indicators (or KPIs) as a food blogger, and how that will impact the kinds of data you’ll want to collect within GA4.
How to Get the Data You Need From GA4
One of the positive aspects of GA4 is just how customizable and flexible it is compared to UA.
One of the aspects of GA4 that you might want to customize has to do with the Google signals Blended Model of data analysis, which isn’t ideal for commerce purposes (like if you’re selling products on your site).
In addition to not being well-suited to tracking commercial data, if you think your GA4 data looks really off compared to UA, it’s worth a try to change the reporting identity in GA4.
Alison walks listeners through Google signals (per Google, the “session data from sites and apps that Google associates with users who have signed in to their Google accounts”) and how to change your reporting identity to device-based. This data should be a little closer to what you would have seen in UA on an individual basis. Check back a few days later and see if the data looks better (i.e. more like the numbers you were seeing in UA) — if not, change the reporting identity back to the Blended Model.
Because it’s a little technical (we see you, GA4), we wanted to share some screenshots of this workflow so that you can implement it at home:
Go into Google Analytics admin (the gear) in the bottom left corner (property column).
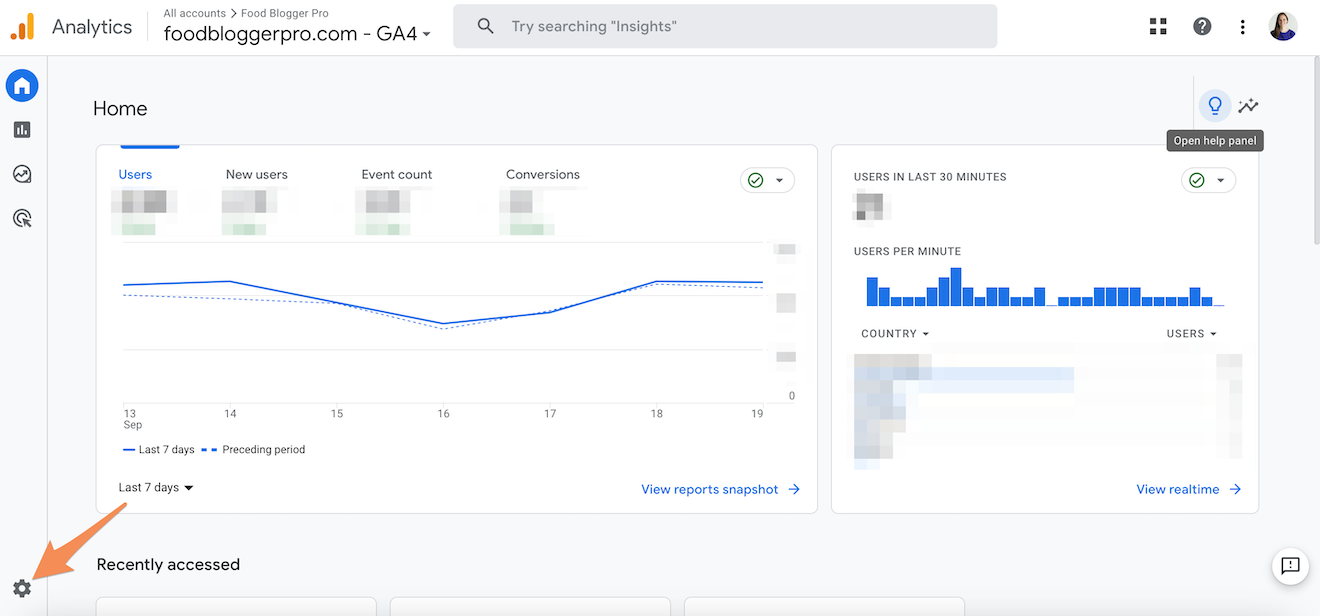
Click ‘Reporting Identity.’
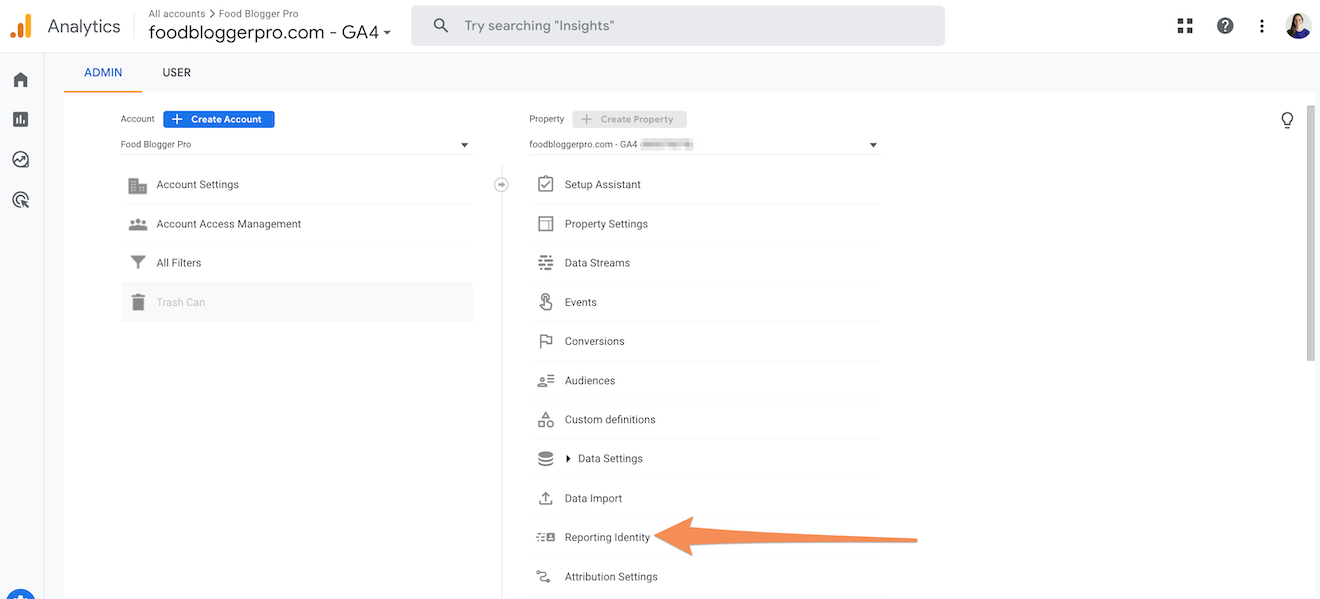
You’ll see Blended at the top (likely selected) and then ‘observed’, click ‘See All’, and then ‘Device-based.’
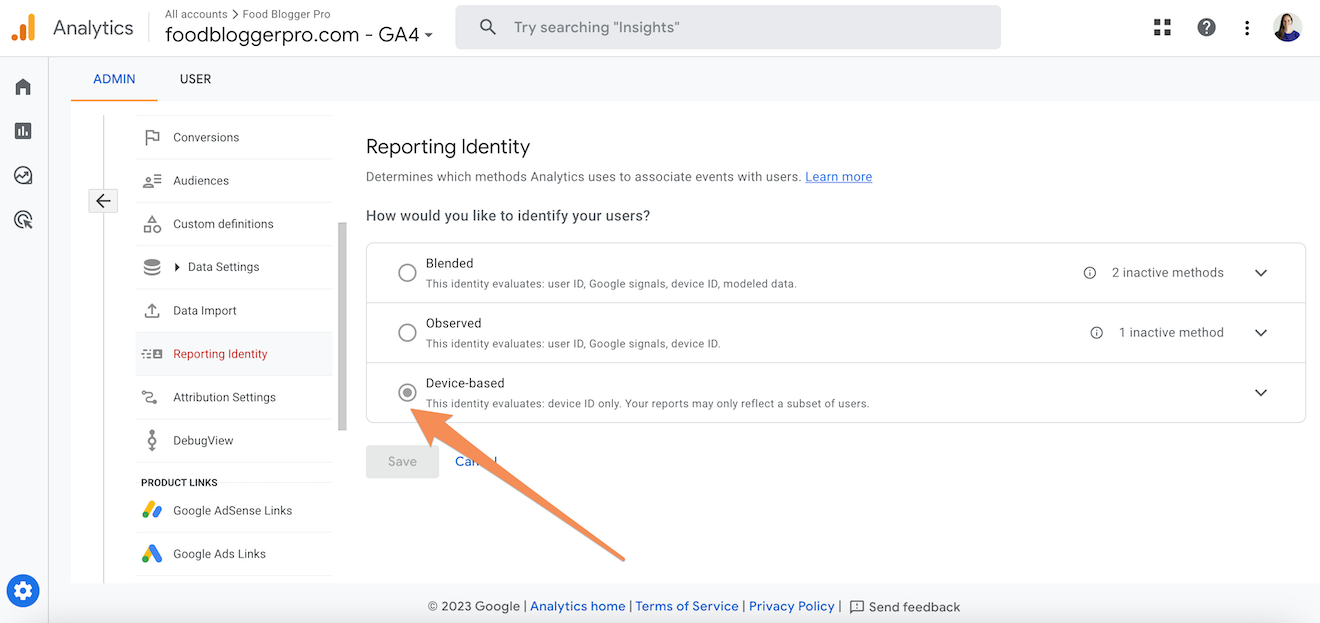
Switch to device-based to get data that is closer to what you would have seen in UA on an individual basis.
You can always switch back and forth between Blended and Device-based, and you will need to if you also want access to demographic data about your users.
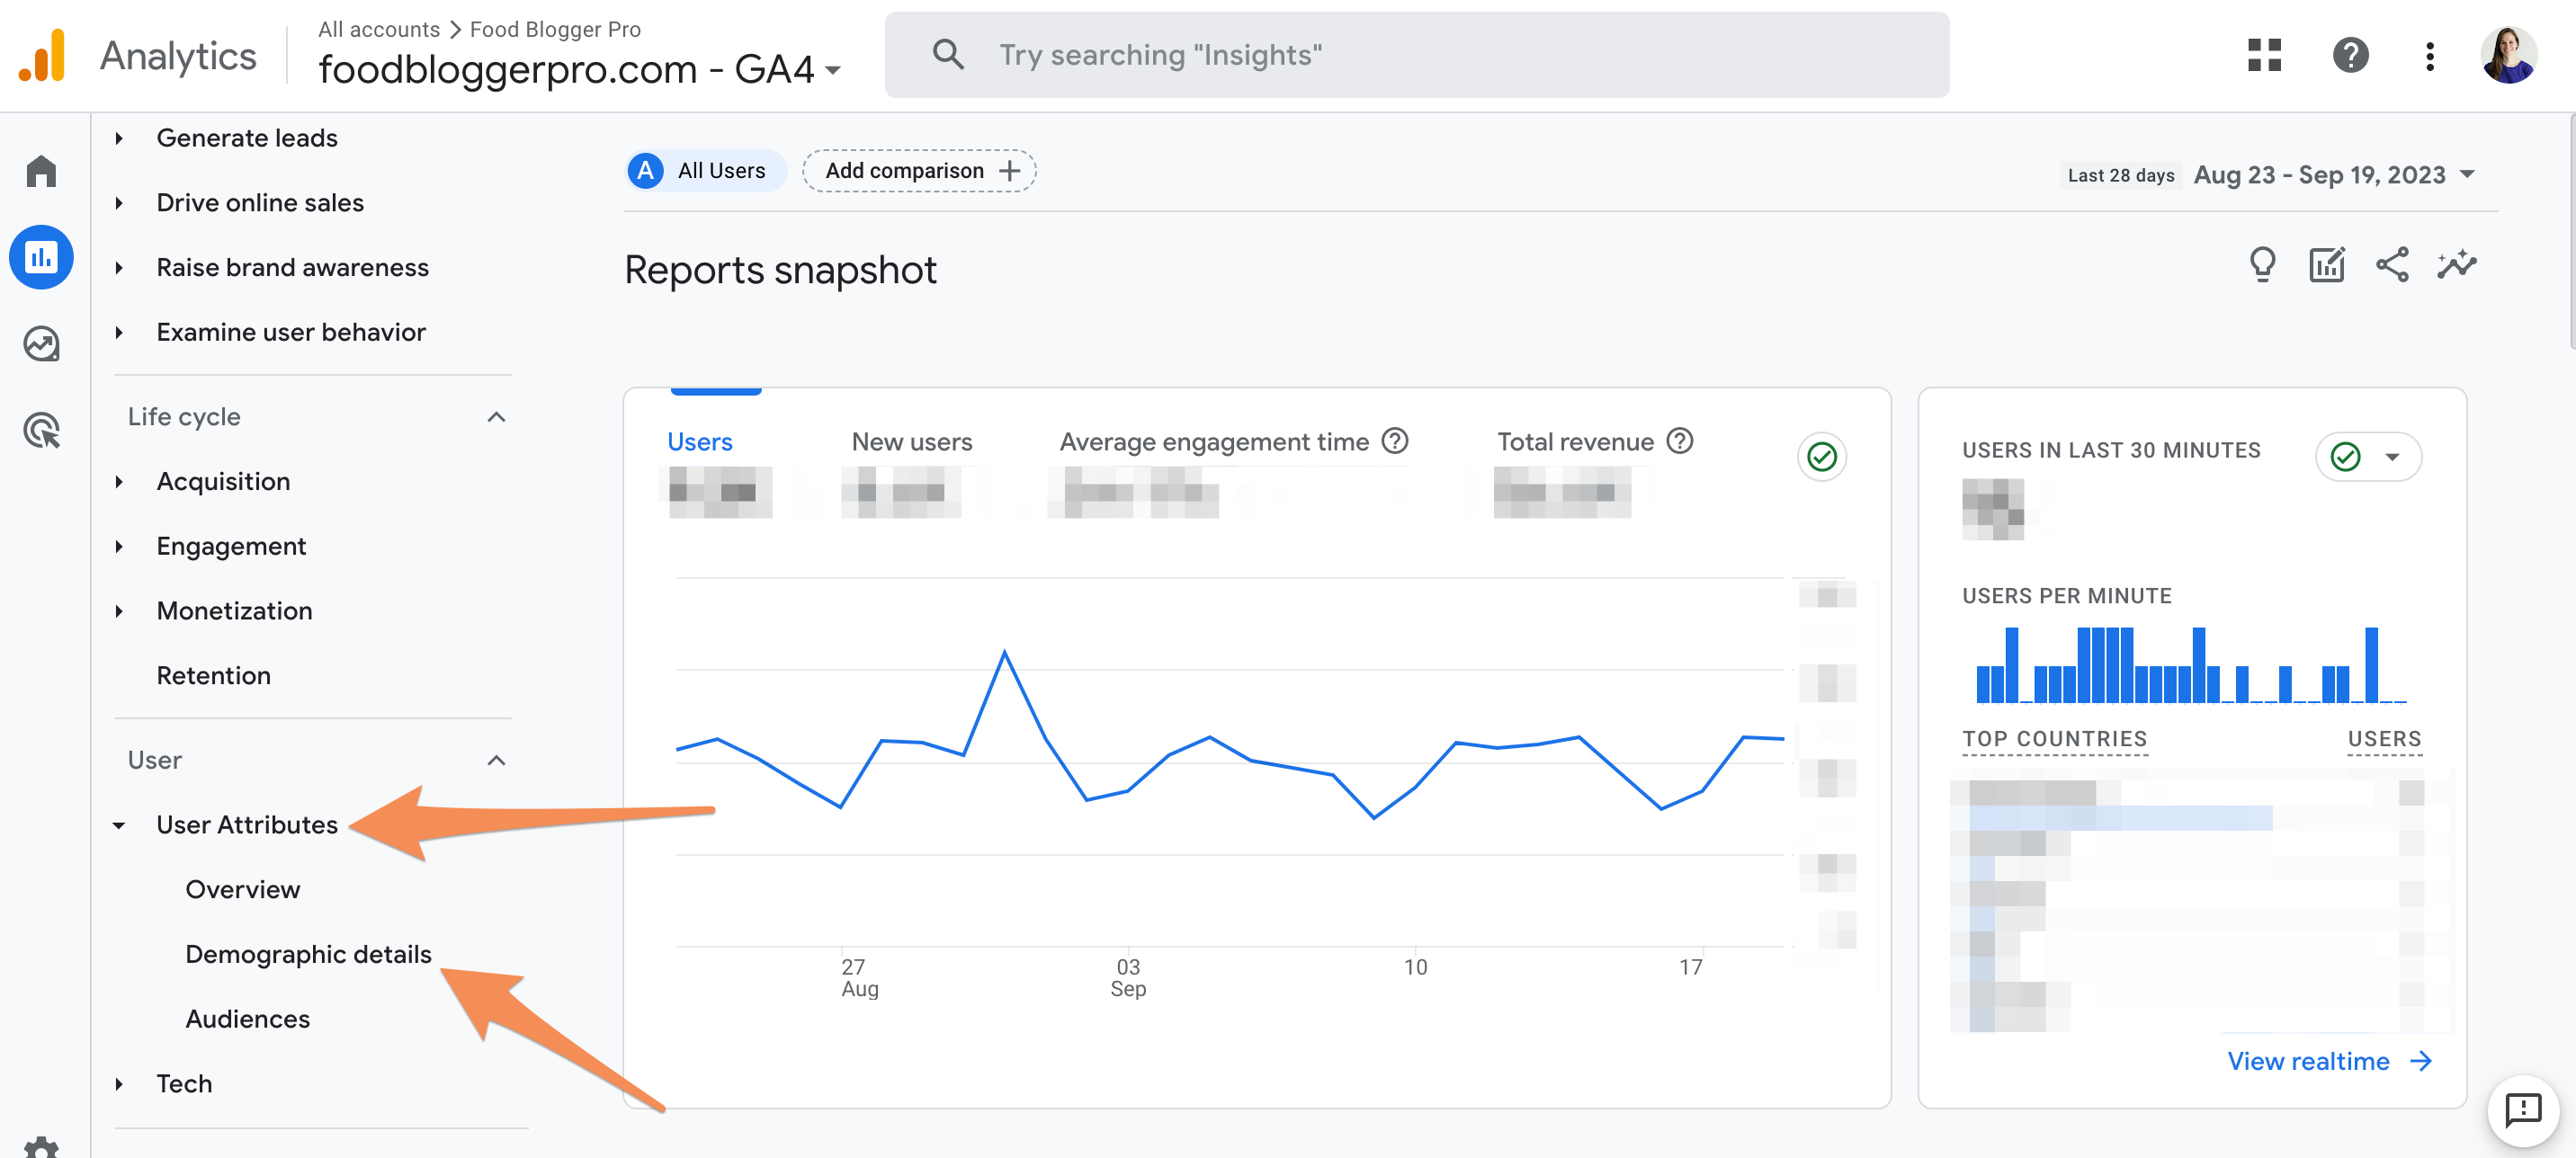
Speaking of… curious about how you can access the demographic report on GA4? Let’s walk through it:
Click on Reports.

Click on User Attributes to expand the options and then click Demographic details.
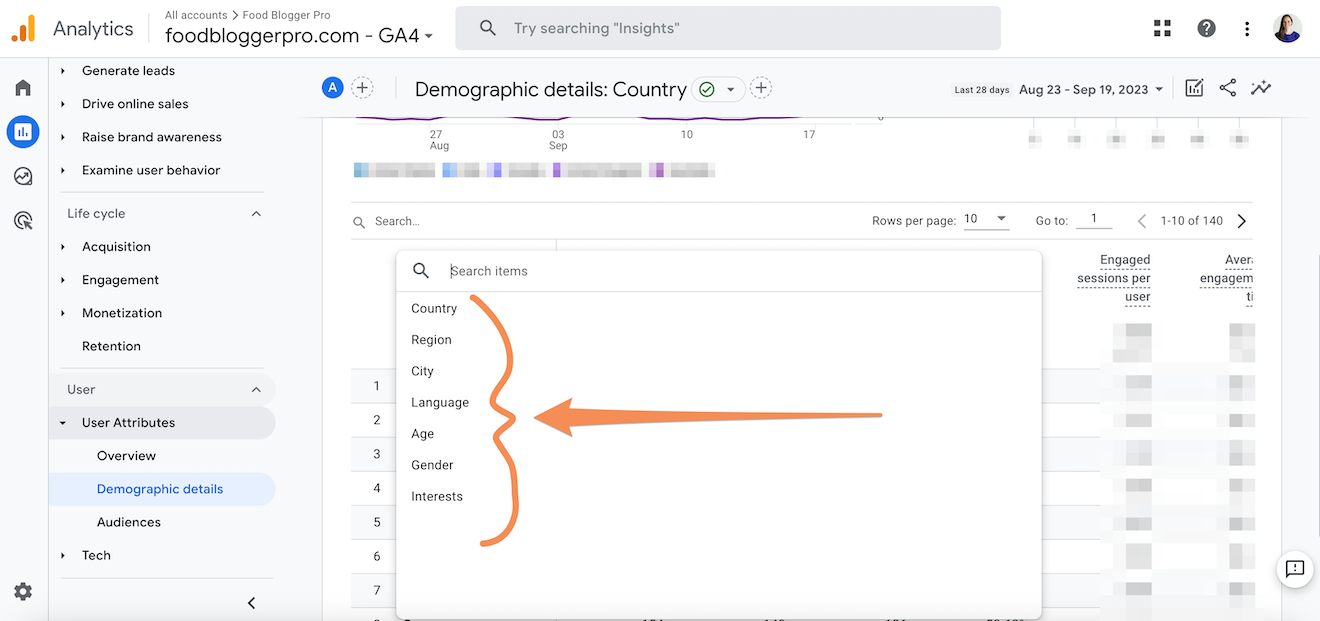
If you only see data about countries, you may need to use the dropdown menu for the primary dimension.
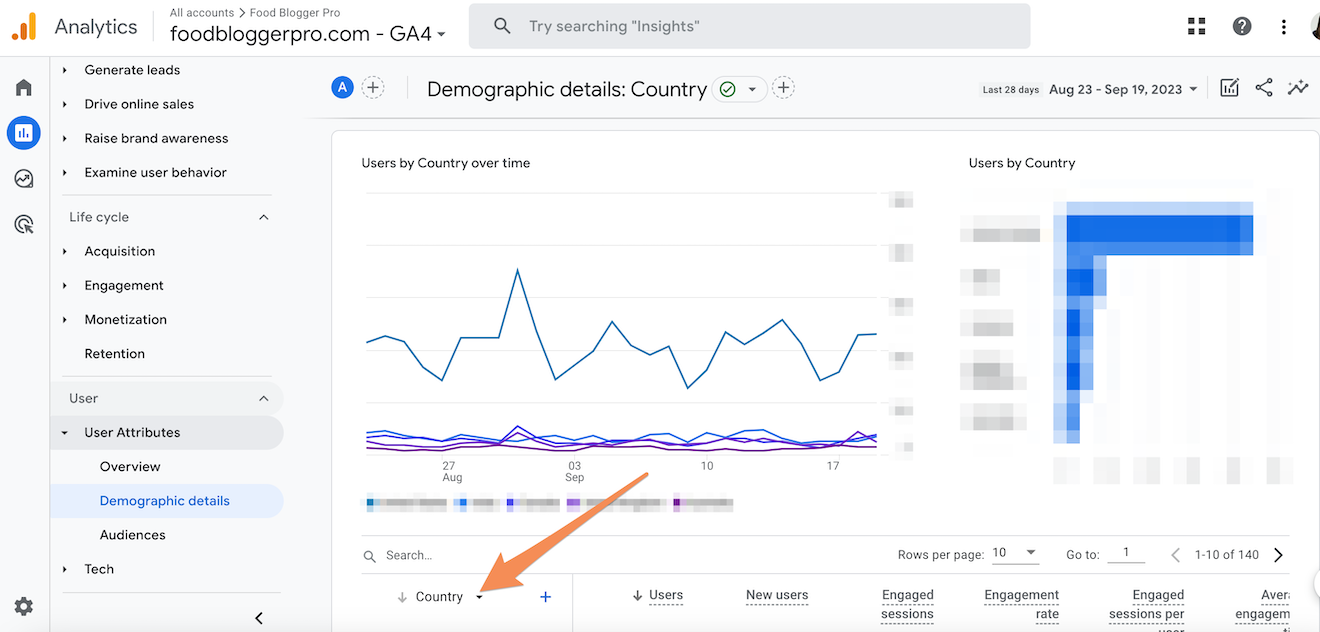
Once you click on Country, you’ll be given all of the other demographic data options you can view.
A quick note here is that if you’re collecting demographic data from your users, you should disclose that in your website’s privacy policy (more on that from Google, here).
And that wraps up our first episode of Tiny Bites! We hope you enjoyed this mini-podcast episode and that it makes your learning curve with GA4 a little bit less steep.
Learn more:
- Google Looker Studio
- 363: What Bloggers Need to Know About Google Analytics 4 with Alison Bechdol
- Digital-ade
- The Insite Co
If you have any comments, questions, or suggestions for interviews, be sure to email them to [email protected].
Learn more about joining the Food Blogger Pro community at foodbloggerpro.com/membership
Transcript (click to expand):
Emily Walker: Hey there. This is Emily from the Food Blogger Pro team, and you’re listening to Tiny Bites. Tiny Bites is a brand new podcast from the Food Blogger Pro team that is a current events podcast. These episodes are going to be a little shorter than our usual podcast episodes, and they won’t be released weekly, but instead whenever we feel like there’s something happening in the food blogging world that we just can’t wait for a regular episode to talk about.
So these episodes might be solo episodes with Bjork, or we might bring in industry experts to help unpack whatever’s going on in the food blogging space. We won’t be releasing these episodes weekly, like I said, but when we do release them, they’ll be coming out on a Thursday or Friday. So just keep an eye on your podcast feed for Tiny Bites episodes on those days of the week.
These episodes won’t have formal introductions and there won’t be any ads, but we will have show notes on the Food Blogger Pro website in our podcast page, where you can find resources and links to learn more. So keep an eye out for those. We’re really excited to be able to bring you a podcast episode that can address current events as quickly as possible, and we really hope you guys will enjoy these episodes. So without further ado, I’m going to let Bjork take it away.
Bjork Ostrom: Allie, welcome to the podcast.
Alison Bechdol: Thank you. Thanks for having me.
Bjork Ostrom: We’re trying something called Tiny Bites, which is kind of a play off of our parent company, which is Tiny Bit, but also it ties into the idea for these podcasts, which is there’s a lot of stuff that happens quickly in our industry and things that we need to know, and we want to do these interviews in a way where we’re able to surface things that people need to know in a timely manner.
So we’re not going to schedule this interview way out. It’ll turn around relatively quickly, and people will get to get this information because it’s important information about things that are happening, specifically around Google Analytics Four. So for those who have maybe put their head in the sand, aren’t aware of what happened, can you talk about Google Analytics Four and the big change that happened this summer?
Alison Bechdol: Sure, definitely. So Google Analytics, as we knew it, was Universal Analytics. Google decided to discontinue use of Universal Analytics starting July 1st of 2023. In its place took Google’s new solution to an analytics platform, which is GA4. GA4, Google Analytics Four, uses and collects data completely differently from Universal Analytics. There’s a lot of setup that needs to happen. There’s some different metrics and definitions, so it’s a completely new ball game, but everyone’s in this learning period right now. So this was not a, hey, let’s do this. It was kind of forced upon everybody, to be honest.
Bjork Ostrom: It wasn’t a choice you had, it just happened.
Alison Bechdol: No. Yes, exactly. And there’s things still evolving. I mean, I even was probably on the record at some point somewhere thinking that they were going to push the date back, that things weren’t ready. It was pretty, I guess, communal that we all thought that it was not quite ready yet. So the fact that we need to do these updates, I was anticipating because hey, Google’s just rolling stuff out as it happens.
Bjork Ostrom: And Google is kind of infamous for being this company that, different than Apple, where Apple waits until everything is perfect and then they release something, Google is known to maybe do that a little bit quicker, or also will push something out when it’s not fully baked and say like, “Hey, we’re going to update this over time. It’s going to get there eventually.”
So on July 1st, that change did indeed happen, and that’s what they’re saying was going to happen. You also had said like, hey, this might not be ready. It kind of wasn’t ready because I mean, it was in the sense that it worked, it was fine, but there’s also a lot of pieces that are like, wait, how do you do this? Does this work? I had this thing before, now I don’t have it. So first of all, the question is what happened to your old account on July 1st when the change switched over?
Alison Bechdol: So you might be surprised. If you do still have a Universal Analytics account, if you saw traffic post July 1st, 2023, you are not alone. So that was definitely something that Google said everyone’s shutting down July one, Universal Analytics is no more. Well, it turns out that actually wasn’t necessarily true because there definitely are accounts that continue to collect data. I have seen it even just recently on some of my accounts, like within the last week that it stopped actually capturing data.
So what that means, though, is that it stopped capturing, but all the data’s still there. Google Analytics hasn’t quite come out with a good solution on what to do with this data yet. I wish it was as easy as export from Universal, import to GA4, but that’s unfortunately not the case. So we are still waiting on what the best practices to do with this data. If you want to get ahead of it, I’d recommend taking a look at some data warehouses, seeing if they have any solutions for you specifically, just to hang onto the data in case you do want to end up using it in the future. Or maybe someday we can actually blend all of this perfectly seamlessly, but that would be my recommendation if you are really worried about your historical data.
Bjork Ostrom: Got it. Yeah, and it’s interesting, I just pulled up Pinch of Yum Analytics, and you can see July 1st, still working, August 1st, still working, and then last day was August 11th. It goes to zero. So now we have this, and it’s a really valuable tool for publishers, this information, historical information to know, hey, have things grown since 2020? Have things fallen off?
To do that analysis, and one of the things you talked about was a data warehouse, and I know that you helped Pinch of Yum set up something within Google Studio to do some of that compare and contrast. So can you talk about Google Studio? Is that considered a data warehouse or should we look at something else as a solution for that, for data warehouse, whatever?
Alison Bechdol: Yeah, yeah, yeah, great question. So yeah, Google Data Studio or Looker Studio, they’ve changed the name in the last six months, that is a data visualization tool. So similar to a Power BI or Tableau, if you’re familiar with those kinds of products out there. Google Looker Studio is their free version of that. One thing that’s really awesome about Looker Studio is that we’re able to take data from third parties, third parties being Universal Analytics, GA4, Facebook even. We can bring Pinterest, we can bring in from a bunch of different third parties and have all of that data live in one spot.
So that dashboard through Looker Studio is a great place, if you do still want to have some of that historical data at least visualized in one place, yes, you can definitely still do that. However, just knowing that there’s not going to be any future Universal Analytics data there. We’re also just not sure from a Google Analytics standpoint how long they’re going to keep the data. So that’s where it says, hey, yeah, we can still access it as long as it’s there, but as soon as Google Analytics says, hey, we’re not holding onto anybody’s Universal Analytics data anymore, that’s where, all right, we need to download it. We need to have it, own it ourselves. Either keep it in a data warehouse, keep it somewhere. That’s going to be kind of the next step there.
So right now, yes, we still can use a data visualization tool native to Google to get some of that data, historical information, but who’s to say that that might be different in a month, unfortunately.
Bjork Ostrom: Yeah. And so Looker Studio, I was just looking this up. I used to call it Google Data Studio.
Alison Bechdol: Data Studio, that’s what it was called. They just changed it.
Bjork Ostrom: And then it looks like Looker was a company that Google acquired, and so now they call it Looker Studio, which is essentially this tool that brings in different metrics from different places. It could be, like you said, Facebook, it could be Google information, but it compiles that and then you’re able to create a graph or you’re able to do charts and things like that. You’re able to just, kind of like a studio for you to create different visuals that help you understand the information that you’re bringing in.
And your point is Universal Analytics can be one of those third party sources that you bring in now, but there’s no guarantee that at some point Google doesn’t say, hey, this is old, we’re going to turn this off. And so if that’s the case, where’s one of these warehouses that you could move it into, and what does that process look like?
Alison Bechdol: Yeah, I mean there’s a bunch of different solutions out there. Like I said, I’m not sure what the best practice is quite at this point. I’m sure there’s a lot of people out there that don’t know, but there are a lot of data warehouses, which is essentially just a server that can hold your data for you in a place that is not just on your local device or that, hey, your computer gets stolen or it gets broken or something happens, then all of it’s gone.
And because it’s quite a bit of data, that’s where using a warehouse is such where they can keep it for you and it’s not going to take up a bunch of space or a hard drive or something like that. They’ve got a way to hold it in a better space. So there are, go ahead and take a look at some data warehouse solutions if that is something you wish to move forward with or get ahead of. Like I said, I do hope that Google comes up with something soon, at least a nice way to maybe even just put a bow on it so it’s like, hey, here’s your thing, but one can only help.
Bjork Ostrom: And so there’s not a solution right now.
Alison Bechdol: Correct.
Bjork Ostrom: Probably because, well not like a built-in package solution that Google’s like, here’s our recommendation for exporting data from Universal Analytics. And so right now there’s not a huge risk in just continuing to have that information in the old account, but at some point it might make sense and Google would probably make an announcement, hey, we’re turning this off in a year.
At that point, there’d be some solutions that would spin up. People would look into it. They’d have some best practices around getting that information out. If you just wanted to be safe right now, is there a way that you can do an export of your entire Universal Analytics account and just store it locally?
Alison Bechdol: I believe so. I honestly haven’t moved that route myself, but there is a way to export and import data in Universal Analytics. You’ll want to do that on the property level. So that’s going to be in your middle column in your admin console. So there should be an export functionality. Again, it probably is going to be some JSON files, some HTML. I’m sure that there’s a lot of files in there. But yeah, that’s where I would start if you do want to take a look at what that might entail.
Bjork Ostrom: And the idea with that, again, it’s not like you’re going to be using that somewhere or analyzing it. You’re just storing it as just in case.
Alison Bechdol: Right.
Bjork Ostrom: It’s really like a insurance against some weird thing happening where that goes away in Universal Analytics, which we wouldn’t anticipate that happening.
Alison Bechdol: Right, exactly.
Bjork Ostrom: So how about for the people who haven’t made the switch yet? They would log into their account. Like if we hadn’t made the switch, we would log in and August 11th we suddenly wouldn’t have any information anymore. My guess is most people who are using this frequently would have made the switch over to Google Analytics Four, but let’s say somebody hasn’t. What do they need to do in order to make that switch, and anything they should be aware of in that process?
Alison Bechdol: Definitely. So there’s a couple things that Google did to help people who weren’t in our position, that we were kind of getting ahead of it. What essentially Google did is that it took your Universal Analytics property and did its best to transition it into a GA4 property. With that, there’s obviously, as we mentioned before, it’s not apples to apples. So there is some stuff that feels kind of wonky because it just doesn’t quite fit with the new platform. So it does exist, though, and it very well could be that you do have a GA4 account.
There’s going to be two things that are happening. Either the data is collecting, which is great, which essentially means that you were using a new enough version of the tracking code for Universal Analytics that GA4 was able to jump onto that and then be able to pull data from. So you might be getting data, which is great. You don’t have to do anything at least at this point. The other thing that might be happening is you have no data. You don’t have this new tag or this new code in place, so you need to get it installed.
A couple things we can do there, just depending on your platform. If you’re using a WordPress, go ahead and take a look at Google Site Kit if you’re not using that already. I know Monster Insights also has one, there’s a handful of plugins. Be able to make sure you can just get it installed and running on your site. Google Tag Manager is also an option. A couple different solutions out there.
But yeah, I would definitely just get the code on your site. Google does have a pretty good helping system. It even says you can put your website in and it will scan your website for, hey, this looks like a Shopify website, hey, this looks like a WordPress website. This is how you should go ahead to install this. So there are some. They do try to do a decent job at helping users with that.
Bjork Ostrom: Where is that? Is that like a tool that Google has that you can-
Alison Bechdol: Yes, it’s their setup assistant essentially. So it’s usually at the very top. It’s like you kind have to go through all of the steps. You might also still see this big red scary bar of things that need to be done. There’s just a manual checklist you need to check off once things are going. But yeah, so that’s what I would do. Just get the data running. From there, there’s a lot that can be done with GA4.
Unfortunately, it’s just a very different platform from Universal Analytics and all of us who knew it very truly that this is, I mean, truly a different monster. So understanding what your KPIs are is definitely the next step for me, is usually kind of what I’m helping with people, is all right, what are your KPIs? What’s important-
Bjork Ostrom: KPIs for those who aren’t familiar?
Alison Bechdol: Yes, key performance indicators. So knowing, hey-
Bjork Ostrom: The things that are really important, essentially. Like, what are your important metrics that you want to track?
Alison Bechdol: Exactly. So let’s just say it’s email subscriptions, for the purpose of our conversation. Great. We know that email subscriptions is going to be a goal we want to make sure people are coming to the site and doing. So what are the KPIs that are saying if that’s actually successful or not?
I like to do this method where I kind of visualize myself through the website, what are all of the different web parts that I need to touch in order for me to sign up for that subscription? I need to hit a page, I need to fill out the form, I need to potentially come back if I’m really engaged. So there’s a bunch of things that need to happen.
Once you have those things lined out, pull out all the verbs, all of the verbs are going to essentially tell you what those KPIs are. So page views, that’s going to be one. Form fills, that’s going to be one. So what are all of those different steps that need to take place in order for us to know what we’re tracking? Once we know that data, it gives us a pretty streamlined version of, all right, where do we need to go? What data do we need to be looking at?
We know then, hey, we can build custom reports. We can use Google Data or Looker Studio to do that as well, to help us understand. So there’s a lot of customization. So that is one of the pros of GA4 I will say, is Universal Analytics we were kind of stuck having to use the audience behavior acquisition reports as they were. Now within GA4, we can actually customize all of the reporting, all of the reports that you see that are most helpful to you. So that’s one thing that you don’t need to know everything because you don’t have to. Not everything’s going to be relevant to you and your business. But GA4 is actually able to reflect your business instead of you reflecting your business how your Universal Analytics is set up.
Bjork Ostrom: Sure, that makes sense. And I think if you haven’t gone through that process before, it’s a helpful one, to think what do you want people to do when they get to your site? For a lot of people we just think page views, page views, traffic, traffic, but it’s like in service of what, and even if you want to get more page views, you can think about how to do that strategically.
You do want people to sign up for email, so then you can message them after. Or even you want to see how many people are clicking the print button on a recipe. That’s important as well. All of these actions that you can track to start to understand the success that your site is having, given what your hope is in terms of what the outcome would be.
Alison Bechdol: Absolutely.
Bjork Ostrom: There’s also been some changes in terms of just language that’s used to describe users, new users. When I look at the reports snapshot right on the main page when I get in, there’s not really a place where I’m seeing page views, and in our world, people talk about page views a lot. So can you talk about some of the language changes that happened and how we should be thinking about those changes relative to what Universal Analytics was?
Alison Bechdol: Sure. So the biggest thing here is that the data, how the data’s collected is different. So once you understand that, it makes a lot more sense about why things are the way they are in GA4. So in Universal Analytics, how the servers really worked is that there were four different types of hits types. There was event, there was a session-based hit, user-based hit. So essentially just ways to identify these different types of things that are happening.
When those things are happening, Google is having to track them individually, not able to track them seamlessly. GA4 tracks everything the exact same, so everything is seamless. So that is where it’s finding out this user journey and understanding what your users are doing before and after an action is significantly easier in GA4 than it ever was in Universal Analytics. So what we’re trying to do there is the reason that these definitions are going to be different because of how the data is collecting is different.
So obviously users is going to be users. We’re all users, individual users, there’s now going to be engaged users, total users, there’s new users. So there are a couple different deviations of these users, trying to just get you the best information possible. Engaged users essentially is a user that is engaged on your site. New users, people that have never been to the site before. So there’s just different little attributes of these user events or these users that you’re able to see.
So that’s going to be why users might be a little bit different. Specifically GA4 also really specializes, one of their prompts is trying to, I keep using this word, it’s not a real word, de-duplicate users across devices.
Bjork Ostrom: Sure, yeah.
Alison Bechdol: So it’s essential. I mean, we’ve all been there, like hey, especially within the food blog industry, how many times do you start looking at a recipe on your phone and you’re like, I’m just going to get my computer because it’s so much easier to just have this in one place instead of having to use my phone all the time.
Great. So GA4, if you’re signed into Google on your phone and you’re signed into Google on your computer, Google can use Google Signals, which is their kind of way of doing that, it’s part of one of their identifiers, to say, hey, great, this user is the same user. So we don’t actually need to count those as two separate users. They are one user having two sessions on two different devices. So you might see a discrepancy I guess, in your data in usership for example, because of this, because things are simplicating, or yeah, I’m just making my own language at this point.
Bjork Ostrom: Yeah. No, I get it.
Alison Bechdol: So there’s things like that. Just because of how things are collected, the data’s going to be different, the definitions are going to be different. So Google has a really great block in their support, I can even send to you, saying, hey, this is what it was in Universal, here’s what it is in GA4, and how it’s different.
Bjork Ostrom: That makes sense. And users can almost be like, I think of it as people.
Alison Bechdol: Yes.
Bjork Ostrom: It’s how many people are coming, and if a person is using an iPhone and then they switch to a computer, it’s not a different person. It’s the same person. And so what Google’s doing is tracking that as one person and using all of their fancy technology to do that. And so it’s helpful because you can see, okay, I know that there are 100,000 people coming to my site, 100,000 users, and of those, 50,000 are new users.
Okay, so that means that there’s 100,000 people and 50,000 of those people weren’t new and 50,000 were. Do you know, because Google Analytics Four is new, will it assume starting the first day that you have it, like everybody is going to be a user and a new user until you have some time and then it starts to recognize, because it can’t pull information from Universal Analytics to know if it’s new or not? Does that sound right?
Alison Bechdol: Yes. So that is also my understanding, is that you’re going to see a higher number of new users right away just because there’s new cookies, new data measurement protocol, things in place that is just going to not know that you had already, you’ve got that Universal Analytics cookie, if you do. Yeah, you might see a higher number of new users to begin with.
Bjork Ostrom: Got it. And then is there an equivalent to page views? There’s users, which that pulls over. Is there page views, and where do you find that?
Alison Bechdol: Yeah, absolutely. So as I mentioned, how things are now tracked all of the same, I know we’ve talked about this on our other podcast as well, the episode. Everything is now event-based, so event-based meaning hey, if I go to a page, that’s an event. If I click a button, that’s an event. If I download something, that’s an event. So everything tracked as events, again, all the same. So yes, now we have a page view event, so that’s page underscore view in your events report, if you see events.
You also, for the metric, it’s just going to be views. So they kind of got rid of the page part of page views for some reason. And actually I think I know the real reason of that is GA4 really was built to support apps and websites. So when you say views, it’s not explicit to page views. It could be screen views of an app. Anyway, so that’s why you might see it as views, as opposed to page views. But the page view event and the event count of page view events will be your page view number.
Bjork Ostrom: Got it. That is really interesting. I see, maybe this is a custom event to Pinch of Yum. Oh, I wonder if it has to do with video. Now I’m just getting into asking you specific questions about RGA. It’s called buffer, but I wonder if that has to do with the video starting. I think this probably has to do with our video.
Alison Bechdol: Probably.
Bjork Ostrom: Buffer-
Alison Bechdol: There’s a couple different video. Yeah, there’s some different listeners, just depending on the video host that you have. If it’s YouTube, obviously that’s Google based. It’s a little bit easier for us to track that out of the box, especially if you’re using Vimeo or something along those lines. You might have access to some different events that might be firing.
Bjork Ostrom: Cool. That’s great. Anything else that you’ve noticed as things that would be worth mentioning or things that have come up when you’ve been working with clients on their GA4, things that are maybe commonly confusing, things like that?
Alison Bechdol: Yeah, I think that there’s one. I’d like to say it’s not big, but it’s definitely been a reoccurring problem that I’ve been seeing. This is something to do with reporting identity, and I’m actually going to kind of go back to that Google Signals chat we were just talking about de-duplicating users.
So Google Signals is a way that we have essentially said this is how we are going to be reporting, using Google Signals and these device IDs. And there’s a couple different, I guess really factors that go into identifying a user on your site. So that’s going to be user ID, Google Signals, device ID, and then modeling. Modeling is essentially if you have cookies disabled on your computer, it’s going to find users similar to you and try to guess the data, which I don’t love, but that’s essentially what it’s doing. So using Google Signals and having this essentially blended way of us to be able to understand these users is how GA4 really recommended everybody set up their data using Google Signals.
Now as time has gone on, able to take a look at the data, we’re seeing a couple things. Specifically for users that have eCommerce businesses, specifically if you’re tracking sales, you’re tracking individual downloads and such, from what we’ve understood is that this blended model is not sufficient. Reason being is that, as I mentioned, that modeling, as I mentioned some of the other kind of blended ways that it’s trying to find the data, Google thinks that if there’s not enough of those events or not enough things happening that you as the owner of your analytics or site will be able to figure out that individual user that’s doing those things.
To me, that’s bananas. The fact that first of all, I’m never going to do that. Second of all, who’s going to be tracking on an individual user basis without a user ID or something like that offline. So it’s a very, in my opinion, silly way why it’s doing this. So while that’s happening, it’s not going to be reporting 100% of what’s accurate on your site. So when we see this, I’m seeing sales that are completely different from what we see in Shopify or data that’s completely off. I’ve been seeing that quite a bit, and it’s very concerning to a lot of people, which I completely understand.
The one other thing that this Google Signals and blended model does do is it gives us demographic reports. So it has to be enabled for you to get age demographics, all of that kind of stuff. You have to be using this blended model. However, as I mentioned, you use that blended model, you get your demographics, great. However, your data might not be super accurate compared to what you might be looking for.
So what we can do is go into your analytics admin in your center column, which is that property column, and you’re going to see a note for reporting identity. So you’re going to click that reporting identity. When you click that, you’re going to see that blended is at the top, most likely selected. The second one I think is observed, which is essentially just not using that modeling, and then device based is actually, you can’t even see it. You have to click see all, and then you’ll see that device-based one as the third option.
So when we switch to device-based or device ID, that is essentially as close as we can get to Universal Analytics or what we were seeing from a hey individual user basis. So that’s what we’re at this point, hey, let’s switch back, let’s switch to device-based. Let’s get rid of this blended, just because things are not looking like they should in our opinion.
The good thing about this, yes, you will be potentially losing your demographic info if you switch to device ID. However, you can switch back and forth between blended and device and observed as many times as you want and all the data will reflect that. It is retroactive. So this is just a new setting that you’re going to have to just become familiar with if you are going to be paying attention to your demographic reports, as well as wanting to make sure that your data is potentially as close as possible.
There’s also some data thresholding issues that also happens with this Google Signals. That’s kind of when it says, hey, you might be able to figure out who this is. You might see a little note at the top. I think it’s a little orange triangle with an exclamation point, essentially just saying, hey, this report is being thresholded because of the Google signals. When you turn that off and enable device-based, that will disappear.
So I’m hoping that if you are seeing some data discrepancies in what you might be considering, if you have another system elsewhere and you’re comparing the two, go ahead and switch over to device-based and just take a look at your data and see if it looks better, see if it’s more on track of what you would expect. I think that that has been quite a bit of a thing that I’ve seen at least a lot in the last couple months.
Bjork Ostrom: And is that, I think probably people hear that and they’re like, oh shoot, it’s not actual accurate information. Are you seeing that mostly with people who have tracking around things like commerce, like purchase-based behavior? You buy a thing and you have Shopify and you know that you sold a thousand dollars of product today, but in Google it shows it as 2000 or something like that.
Alison Bechdol: Right.
Bjork Ostrom: Are you seeing that with issues with actual page view tracking and user numbers?
Alison Bechdol: Not necessarily.
Bjork Ostrom: Or mostly just the commerce type stuff? Okay.
Alison Bechdol: Yeah, mostly the commerce stuff. Maybe some events that are firing weird or having too many that you would expect or too few that you would expect, but that’s traditional. Yes, more in the eCommerce space. But again, the demographic point is really where I do tend to find the people that are not in eCommerce space do still tend to care about the demographics, which in case, yeah, you have to have that blended on to be able to do so.
Bjork Ostrom: And can you explain that again? It’s hard to talk through it on a podcast, but you go into Google Analytics and then-
Alison Bechdol: You’ll go to your admin, which is in the bottom left, that little icon on there.
Bjork Ostrom: You click on that little gear in the bottom left and then you go to, under property, you go to property settings?
Alison Bechdol: Nope. So just go keep on going down and you’ll see reporting identity. It’s about three fourths of the way down, I think.
Bjork Ostrom: Yep, got it.
Alison Bechdol: So when you click that, yep, you’ll see a box.
Bjork Ostrom: You have two options, blended-
Alison Bechdol: It says two options, observed, and then there’s another see all at the very bottom. Click see all, then you’ll see the third for the device-based. Yep.
Bjork Ostrom: Got it. And that would be, people would be looking at that, if they have a commerce site, they notice that things are looking a little bit off, that might get them closer to more accurate information, but they would lose the tracking of demographic information, which would be the downside of doing that.
Alison Bechdol: Correct.
Bjork Ostrom: The other thing that would be worth mentioning is for anybody who uses an ad network, making sure that if you are changing or adjusting any of these settings, that doesn’t, because I know some of the reporting on the ad network side, it ties back to it. So checking in with them. The other question that I had was around demographics. I don’t know, I’m trying to see if we have that on. Would you check in property, that property area if you have that on, because I think that would be important?
Alison Bechdol: You’re just going to look at the report itself. So if you have just the standard GA4 reporting setup, you’ll go to reporting, which is that second bubble on the far left hand utility navigation, click that. And then under engagement, I’m sorry, there’s going to be a lifecycle and then user information, that user cycle, I think it should be at the very bottom on the left. Then if you open that, if you expand that, you’ll see demographics is the report in there.
Bjork Ostrom: Demographic details. Okay, got it. Yep. So for anybody who’s listening in and talking through this, so again, it’s reports on the left side and then you go down to under users, user attribute. Then you can click demographic details and you can see the different countries people are coming from, the percentage, and then all the details on those. And you’re saying if you were to switch over to that ID tracking, that would go away?
Alison Bechdol: Yeah, you’ll see quite a bit of unassigned, which is still to be expected again, where Google’s trying to still figure out, hey, this is a new system. What’s your gender? What’s your age? Those are obviously things we don’t input into Google usually.
So there still might be some unassigned there, but that’s definitely something that you, and you probably are confused at this point. You’re like, I only see countries, where’s the actual demographic stuff? So if you see there’s actually a dropdown for your primary dimension, you’ll be able to select that and that’s where you’re going to see gender, age, interests, those other demographic reports.
Bjork Ostrom: Cool. That’s great. And my guess is, Allie, there’re going to be people who are listening to this and they’re like, this is all important. I want to do this, but I don’t want to do it by myself. Which is great because you have a service and a little agency that focuses on stuff like this to help bloggers and publishers. Can you talk about how people can work with you if they wanted to connect with you and have some help with all things Google Analytics?
Alison Bechdol: Yeah, absolutely. So I have a website, digital-ade.com. So it’s digital-ade.com. On there, feel free to send me a contact form. I’m happy to help. I’m also, actually, this might be new to you as well, Bjork, we are starting kind of a little leg of Digital-ade called The Insite Co, which is going to be specific to data and Looker Studio. So essentially we’ll be building a bunch of different templates that you can just use as is for just a monthly fee, or if you want to have one and then have it customized, that’s also something that we can do for that and support you that way.
So we know that this is important. We know a lot of people want dashboards, they want to visualize their data. GA4 is confusing. It’s a whole new thing to learn. It’s a lot. So if you just don’t want to do that, which I completely understand, feel free to reach out to us. This is, again, you’re not the only one. You’re not alone. We have seen a lot worse than whatever you think you have potentially, or don’t have. So yeah, happy to help out if you just need an ear or someone to talk to about it.
Bjork Ostrom: Awesome. Allie, thanks so much. We’ll put that link in the show notes if people want to check it out.
Alison Bechdol: Awesome.
Bjork Ostrom: And thanks for doing the first ever bite-size episode here. Appreciate it.
Alison Bechdol: Of course. Thanks for having me.
Bjork Ostrom: Thanks.
Emily Walker: Hey there, Emily from the Food Blogger Pro team here. We really hope you enjoyed our first episode of Tiny Bites. And big thanks to Alison for joining us for our inaugural episode. Like I mentioned during the introduction, if you’d like to learn more about the episode, head to foodbloggerpro.com/podcast, where you’ll find the show notes for this episode.
In these show notes, we walk through step-by-step how to do some of the processes that Alison talked about, like changing your reporting identity or finding your demographics reports. We have images and just step-by-step directions that should make it super easy to follow along from at home. So definitely check those out, and we’ll see you again at some point soon for another Tiny Bites episode. Thanks so much for listening.